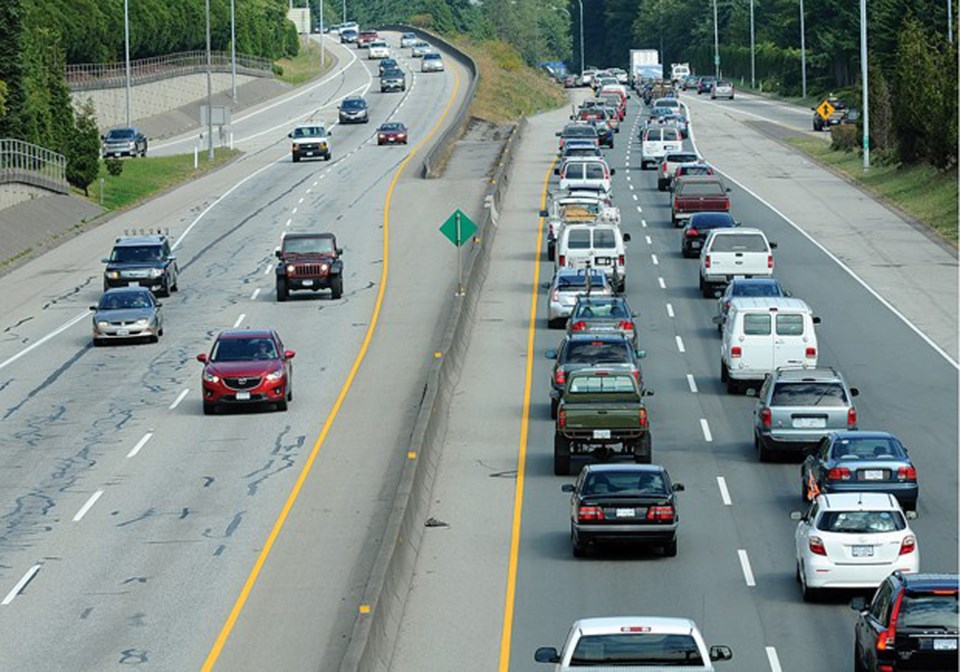
When is North Shore traffic at its worst?
It’s a question many have us have had time to ponder as we lurch along our congested highway or feeder routes over the last decade.
This summer, we conducted an online poll asking for North Shore residents' perceptions of the worst time of year for traffic congestion.
North Shore News polled 1,215 readers and asked them to complete the phrase: North Shore traffic is at its worst...
The poll ran from July 21 to Aug. 4. Of the 1,215 votes, we can determine that 552 are from within the North Shore community. The results were as follows:
Results are based on an online study of adult North Shore News readers that are located in North Vancouver and West Vancouver. The margin of error - which measures sample variability - is +/- 2.8%, 19 times out of 20. North Shore News uses a variety of techniques to capture data, detect and prevent fraudulent votes, detect and prevent robots, and filter out non-local and duplicate votes.
Well, as you will see below, it turns out about 97 per cent of those polled got it wrong.
Barring the pandemic and the disruption it brought to, well, everything, traffic volumes over the two North Shore bridges follow remarkably consistent seasonal patterns, according to numbers provided by the Ministry of Transportation and Infrastructure’s traffic data program, which counts every vehicle that traverses the Lions Gate Bridge and Ironworkers Memorial Second Narrows Crossing.
The number of drivers crossing the bridges gradually rises through the spring, peaking in the summer and then declining again through the fall into winter.
June, specifically, is the busiest month of the year for Ironworkers and Lions Gate bridges, with about 130,000 and 62,000 crossings per day, respectively, in pre-COVID times. The number of vehicles crossing the Ironworkers in December is about 11 per cent lower than its early summer peak.
It’s also worth noting that we are still not back to pre-pandemic traffic volumes. In June this year, the Ironworkers saw 124,385 crossings per day on average, still about five per cent below the average in 2017, 2018 and 2019.
Perhaps it was unfair to ask people what their perceptions were on a topic people get so emotional about. Perhaps it was unfair to poll people on their perceptions of a subject where quantifiable data is available. In any case, it’s a good opportunity to play with data and charts and come away with a better understanding of life on the North Shore.
Caveat emptor
These numbers are based on average daily crossings of the bridges, which gives us an idea of the traffic volume coming to and from the North Shore, not intracommunity to and fro.
Also, if there’s a stall or a collision on the highway on or near the bridges and one lane is out of commission for a period of time, the numbers don’t reflect the arduous experience of the congestion we feel as all feeder routes back up (unless folks see the traffic and opt to stay home/take the SeaBus/bike to where they are going).
Where are you going?
We also don’t know exactly where these drivers are going and why. Are they part of the throngs of tourists headed for Honey Donuts or Lynn Canyon? Is the increase mostly ferry traffic passing through? How many of them are workers here to get the job done? What percentage is our own population crossing Burrard Inlet for work or play?
A summer peak certainly does suggest a big part of the congestion is recreational and ferry traffic.
It’s a bit tricky for a layperson, but there are other data points the ministry offers for us to pull up and analyze, including direction of travel, speed, volumes by hour, day of the week etc.
More illuminating will be commuting data released by Statistics Canada from the latest census, which is due to be released at the end of November.


